I have encountered an absolute mystery of technology today!
Bizarre is the only word for it!
As you know (if you’ve read my earlier posts), I recently bought a Garmin GPS cycle computer to be able to track my journey through Europe. One of the things that I wanted to be sure of before I invested my hard earned cash was that it included an odometer. That is the thing that keeps a record of the overall total distance travelled. You’ve got one built into the speedo of your car. Anyway, the Garmin Edge 800 has an odometer, so that helped in the decision to buy one.
Up till now, I’ve used a little cycle computer that includes an odometer, and it shows that I have now travelled 50,938km since I bought the trike in February 2005. I enjoy being able to quote a number like that – there’s a sense of achievement in it, and I wanted to maintain that with the new gadget.
So, I bought it, and went to enter the total so far of my travelling, and when I did, it kept on showing a total of 42,950km. And when I went for a ride, it wouldn’t go any further. That was it. Actually, when I went to change it again, it showed 42,949.7km. Not a centimeter further.
I did a re-set. Odometer showed 0km. Entered 50,000+ – whatever it was at the time. It pretended to accept the new value, and then said, “No, I prefer 42,949.7.”
And stayed put at that point.
So, an odd thought occurred to me. What would happen if I entered a smaller number? So, I took 40,000km off the total this morning and entered 10,901km, and rode to work. And when I got there it showed 10,915! And when I got home it showed 10,938.
How bizarre is that!
Apparently some clown in a Garmin office somewhere has decided that no-one will ever ride more than 42,949.7km, so that is the maximum that their gadget will allow! What the…?!
As I said, the mysteries of technology!
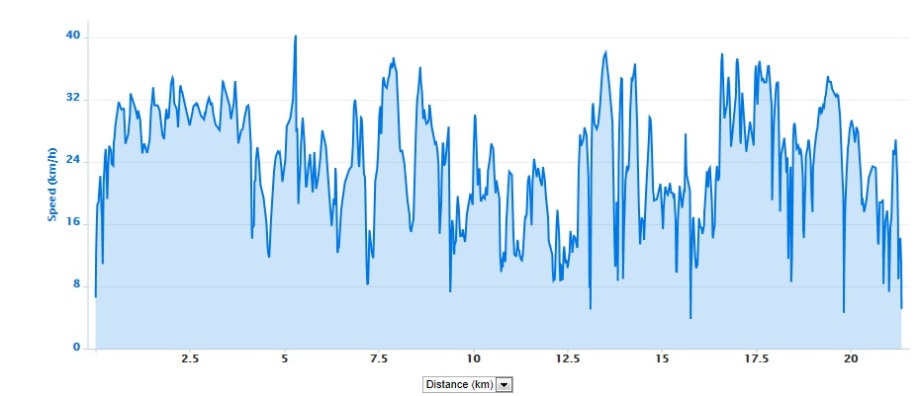
Still, the gadget gives some useful / interesting information. Apart from maps like to one of the Bulli to Unanderra ride, the Garmin website gives some graphs of various features of a ride. My trip home today was rather fun – I went a bit of a longer way home that involved going part of the way around Lake Burley Griffin, and then up the hill to Aranda before heading down to North Canberra. Here are three graphs of aspects of that ride.
First up is Speed.
Then Elevation

And we can add Heart Rate as well

How cool is that? My average Heart Rate was 130bpm and my average speed was about 21.4kph. And I can compare my speed against the elevation and heart rate at any point. Going uphill, the speed drops and the heart rate goes up – not surprising, but the interesting thing for me is how much the speed drops or the heart rate goes up. How fit does this tell me I am, and am I getting fitter over time?
Is it a trifle narcisstic? Probably. Is that a problem? Not really. Is it fun? Absolutely!!